Your data gaps are someone else’s fields.
Live Data OS is a geo 4D mapping system with matching — a data connector, not a custodian. Everyone owns their own data and connects it through ontologies — share and access, not exchange. Geo-ring-fence a place and every party in it becomes a node: from a single building to a town, a region, the nation.
“Everything lives in time and space. Assets live in space — how they operate lives in space-time. The ability to see assets in space, understand what happened over time, and connect a multitude of assets is the key to understanding.”
Joseph Michael Daniels · Live Data OS founder
What it is
A map is the home screen because everything lives somewhere. Assets sit in space; how they perform plays out over time — so the data, the ontologies and the reports behind each point are the fourth dimension. No separate axis to learn: click a point, open its record through time.
Each sector is its own macro view with its own ontology and its own completeness % — Performance, Development & Land and Construction — ratified with one shared method (Cambridge’s UKRI-funded Matchstick engine, P6393).
One connector, every place
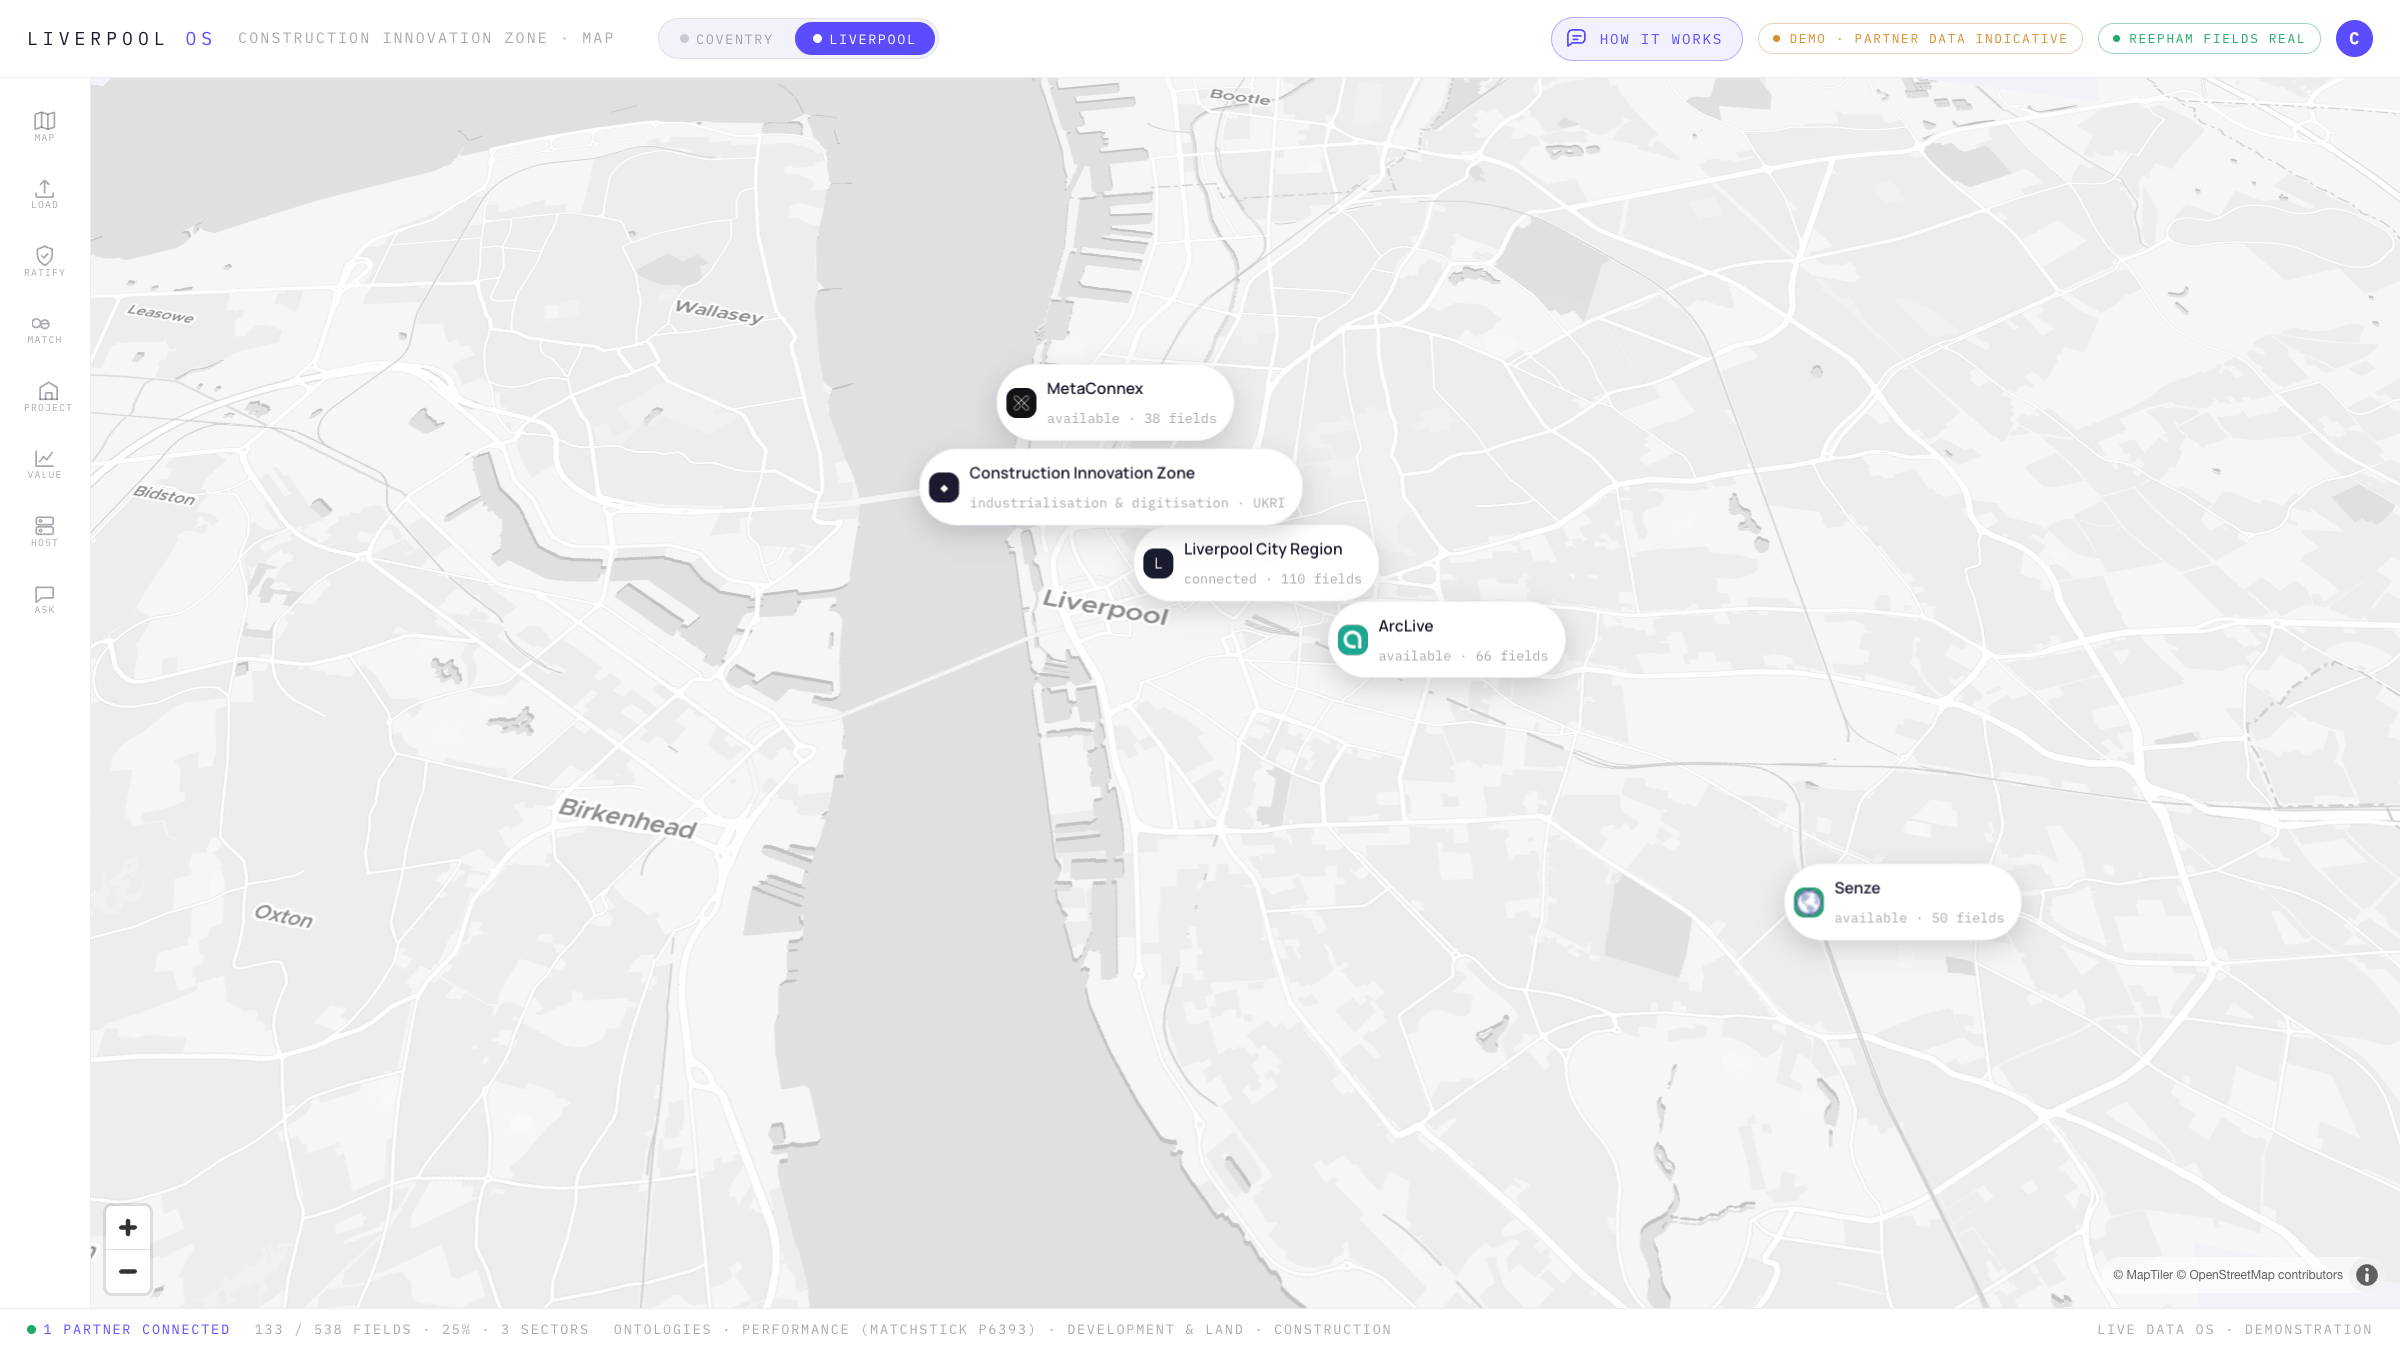
The OS isn’t built for a single city. Geo-ring-fence any place — by public postcode and geolock — and every party inside it becomes a node on its own map. Two operating zones run in the demo today:
Coventry
The first pilot city: a city-centre masterplan across performance, land and construction.
Liverpool
The industrialisation & digitisation of construction — a second zone, same connector, one toggle away.
The ladder
Ontologies → Onboard & match → Your own OS → Local & sovereign.
The ontologies
The common language, open to all. UK NZCBS live; Development & Land and Construction drafted; live streams for energy, water and waste.
Onboard & match
Put your data in as a node on the map and match. The noticeboard compares lists of what each party holds — never the data itself.
Your own OS
A white-label instance for your place or portfolio.
£150k pilot → £500k + platform
Local & sovereign
Onboarding replaces API-piping: storage moves onto LDT micro data centres — local compute, UK-resident, heat reused.
The connectors
Real integration partners, live in the Coventry demo with indicative data. These are the match examples.

ArcLive
Live energy record — thermal & environment. Real measured Reepham anchors: HTC 329.3 W/K, HLP 1.01 W/m²K, 122,410 readings.

MetaConnex
Massing, works and the digital twin for the masterplan project — the place as a delivery object.

Senze
Retrofit data and asset information — stock, refrigerants and space-heating detail.
Where the matching lives
On the noticeboard, never in your data.
- Pieces stay in your box. Your data stays exactly where it lives today.
- You pin up a list, not the pieces. A node publishes which fields it holds — not the values.
- The OS compares the lists. Your gaps are matched against what others hold; a set-complement, computed on catalogs.
- Only a signed deal opens a box. Named purpose, listed fields, fixed & revocable duration, every read logged — or the question travels to the data and only the answer returns.
The product, screen by screen
Captured from the live Coventry OS on the real map. A working prototype on dummy data; the Reepham fields are real.
The workspace
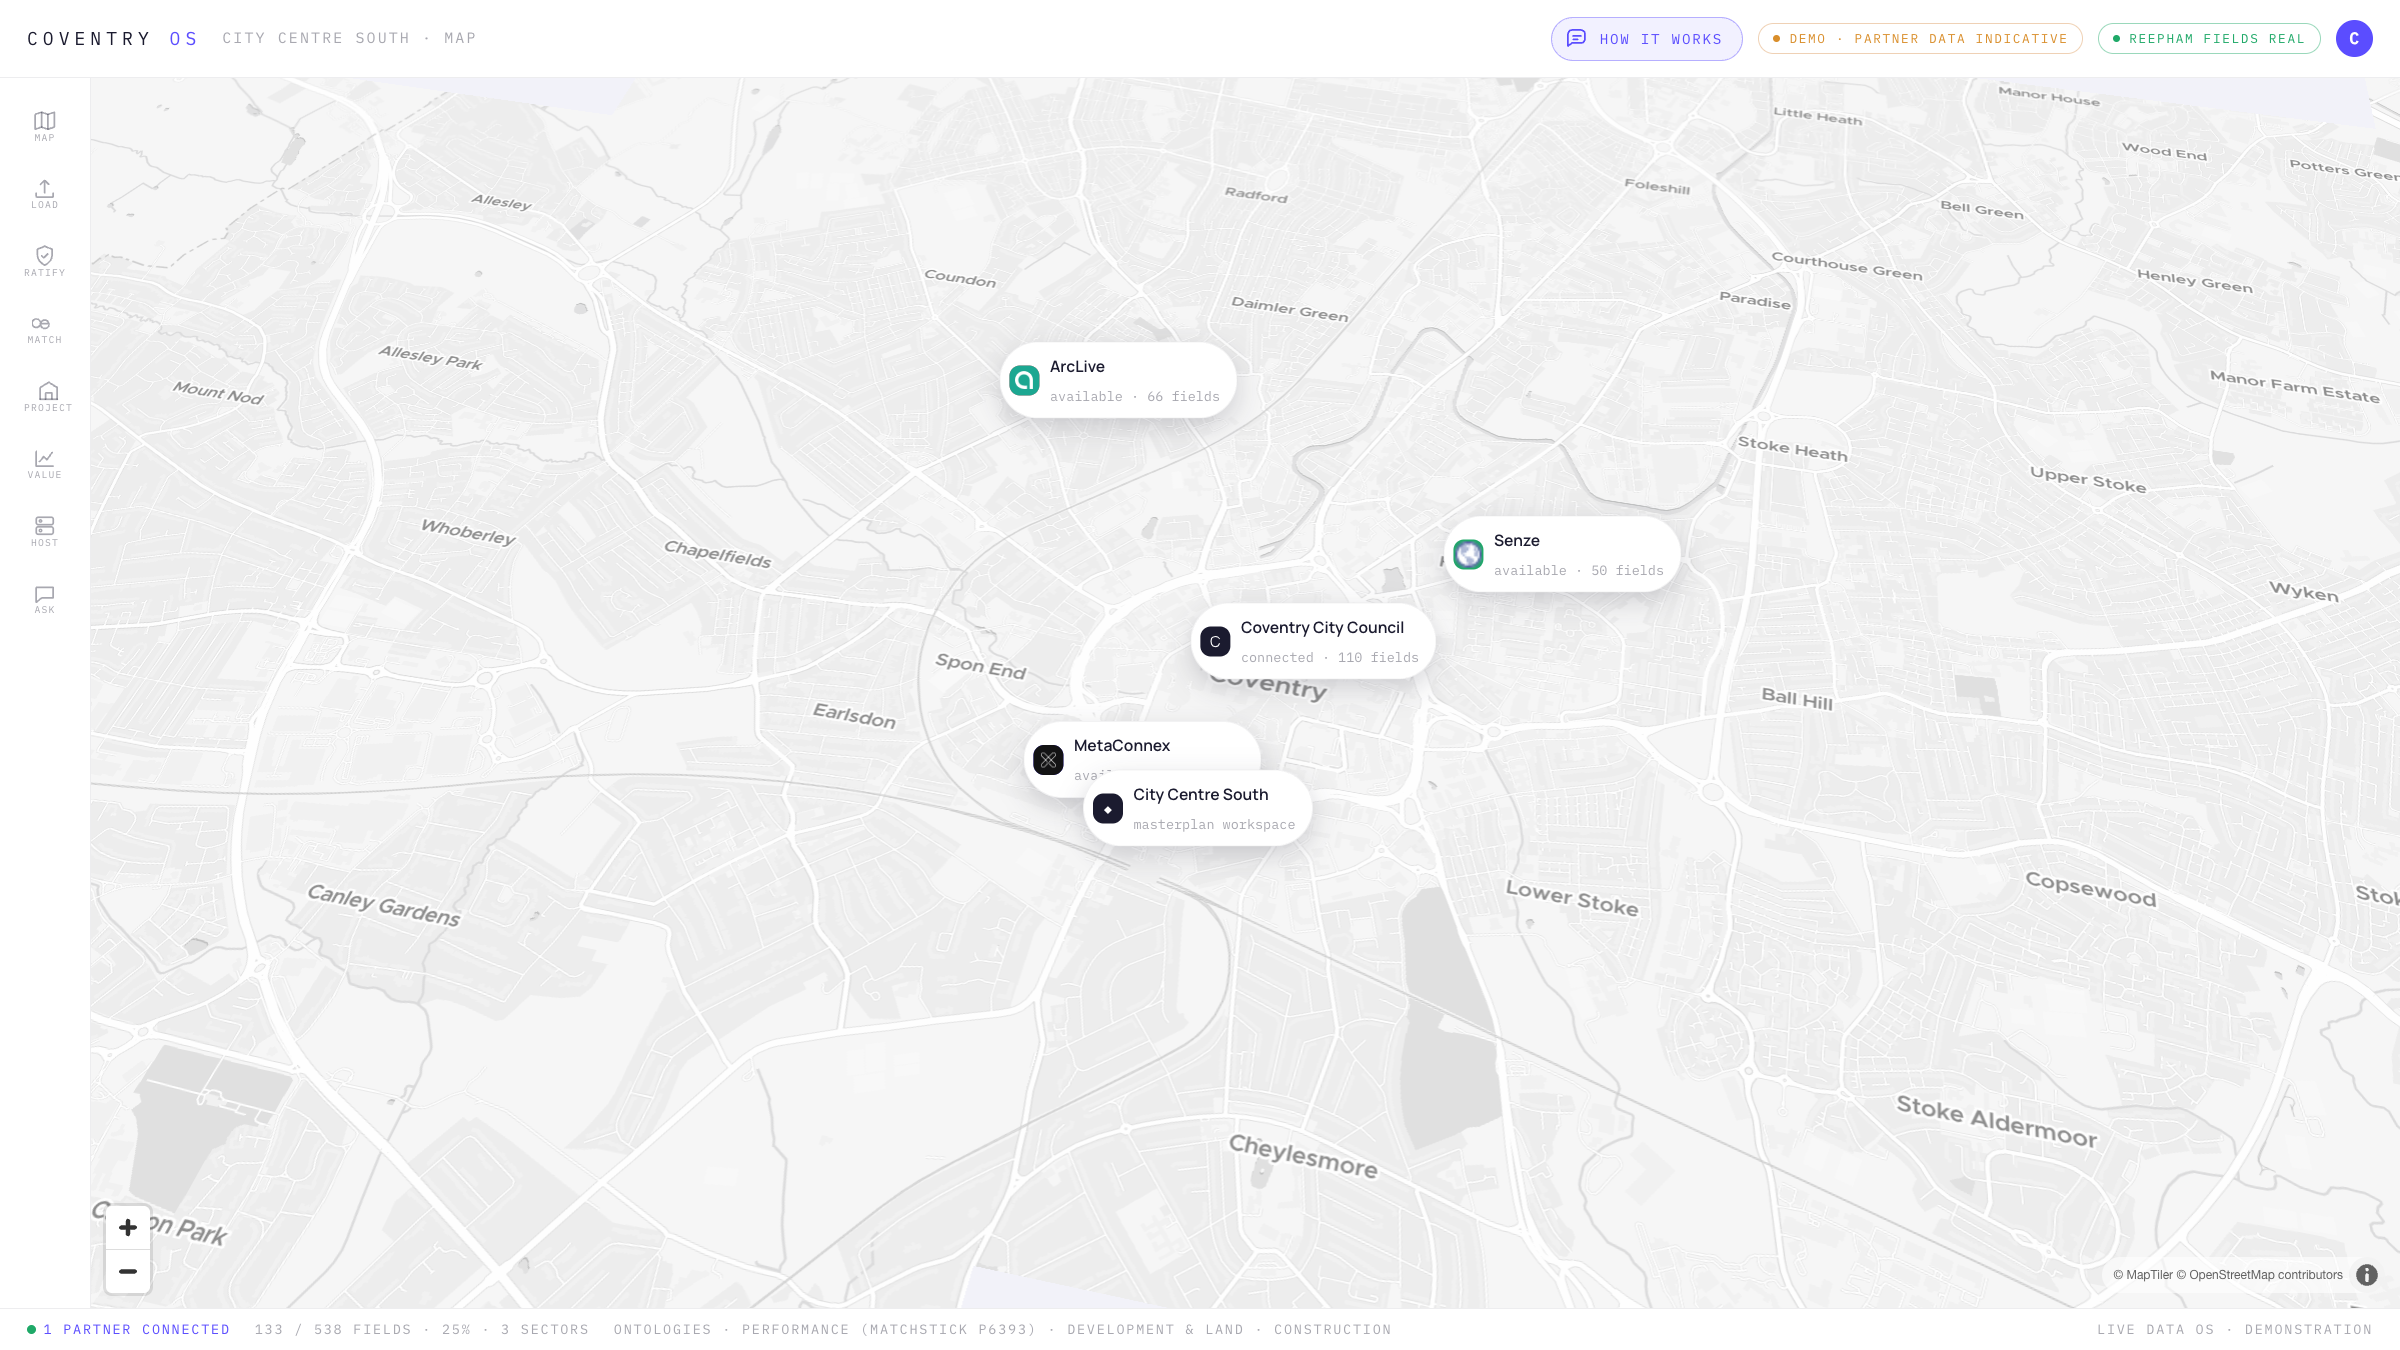
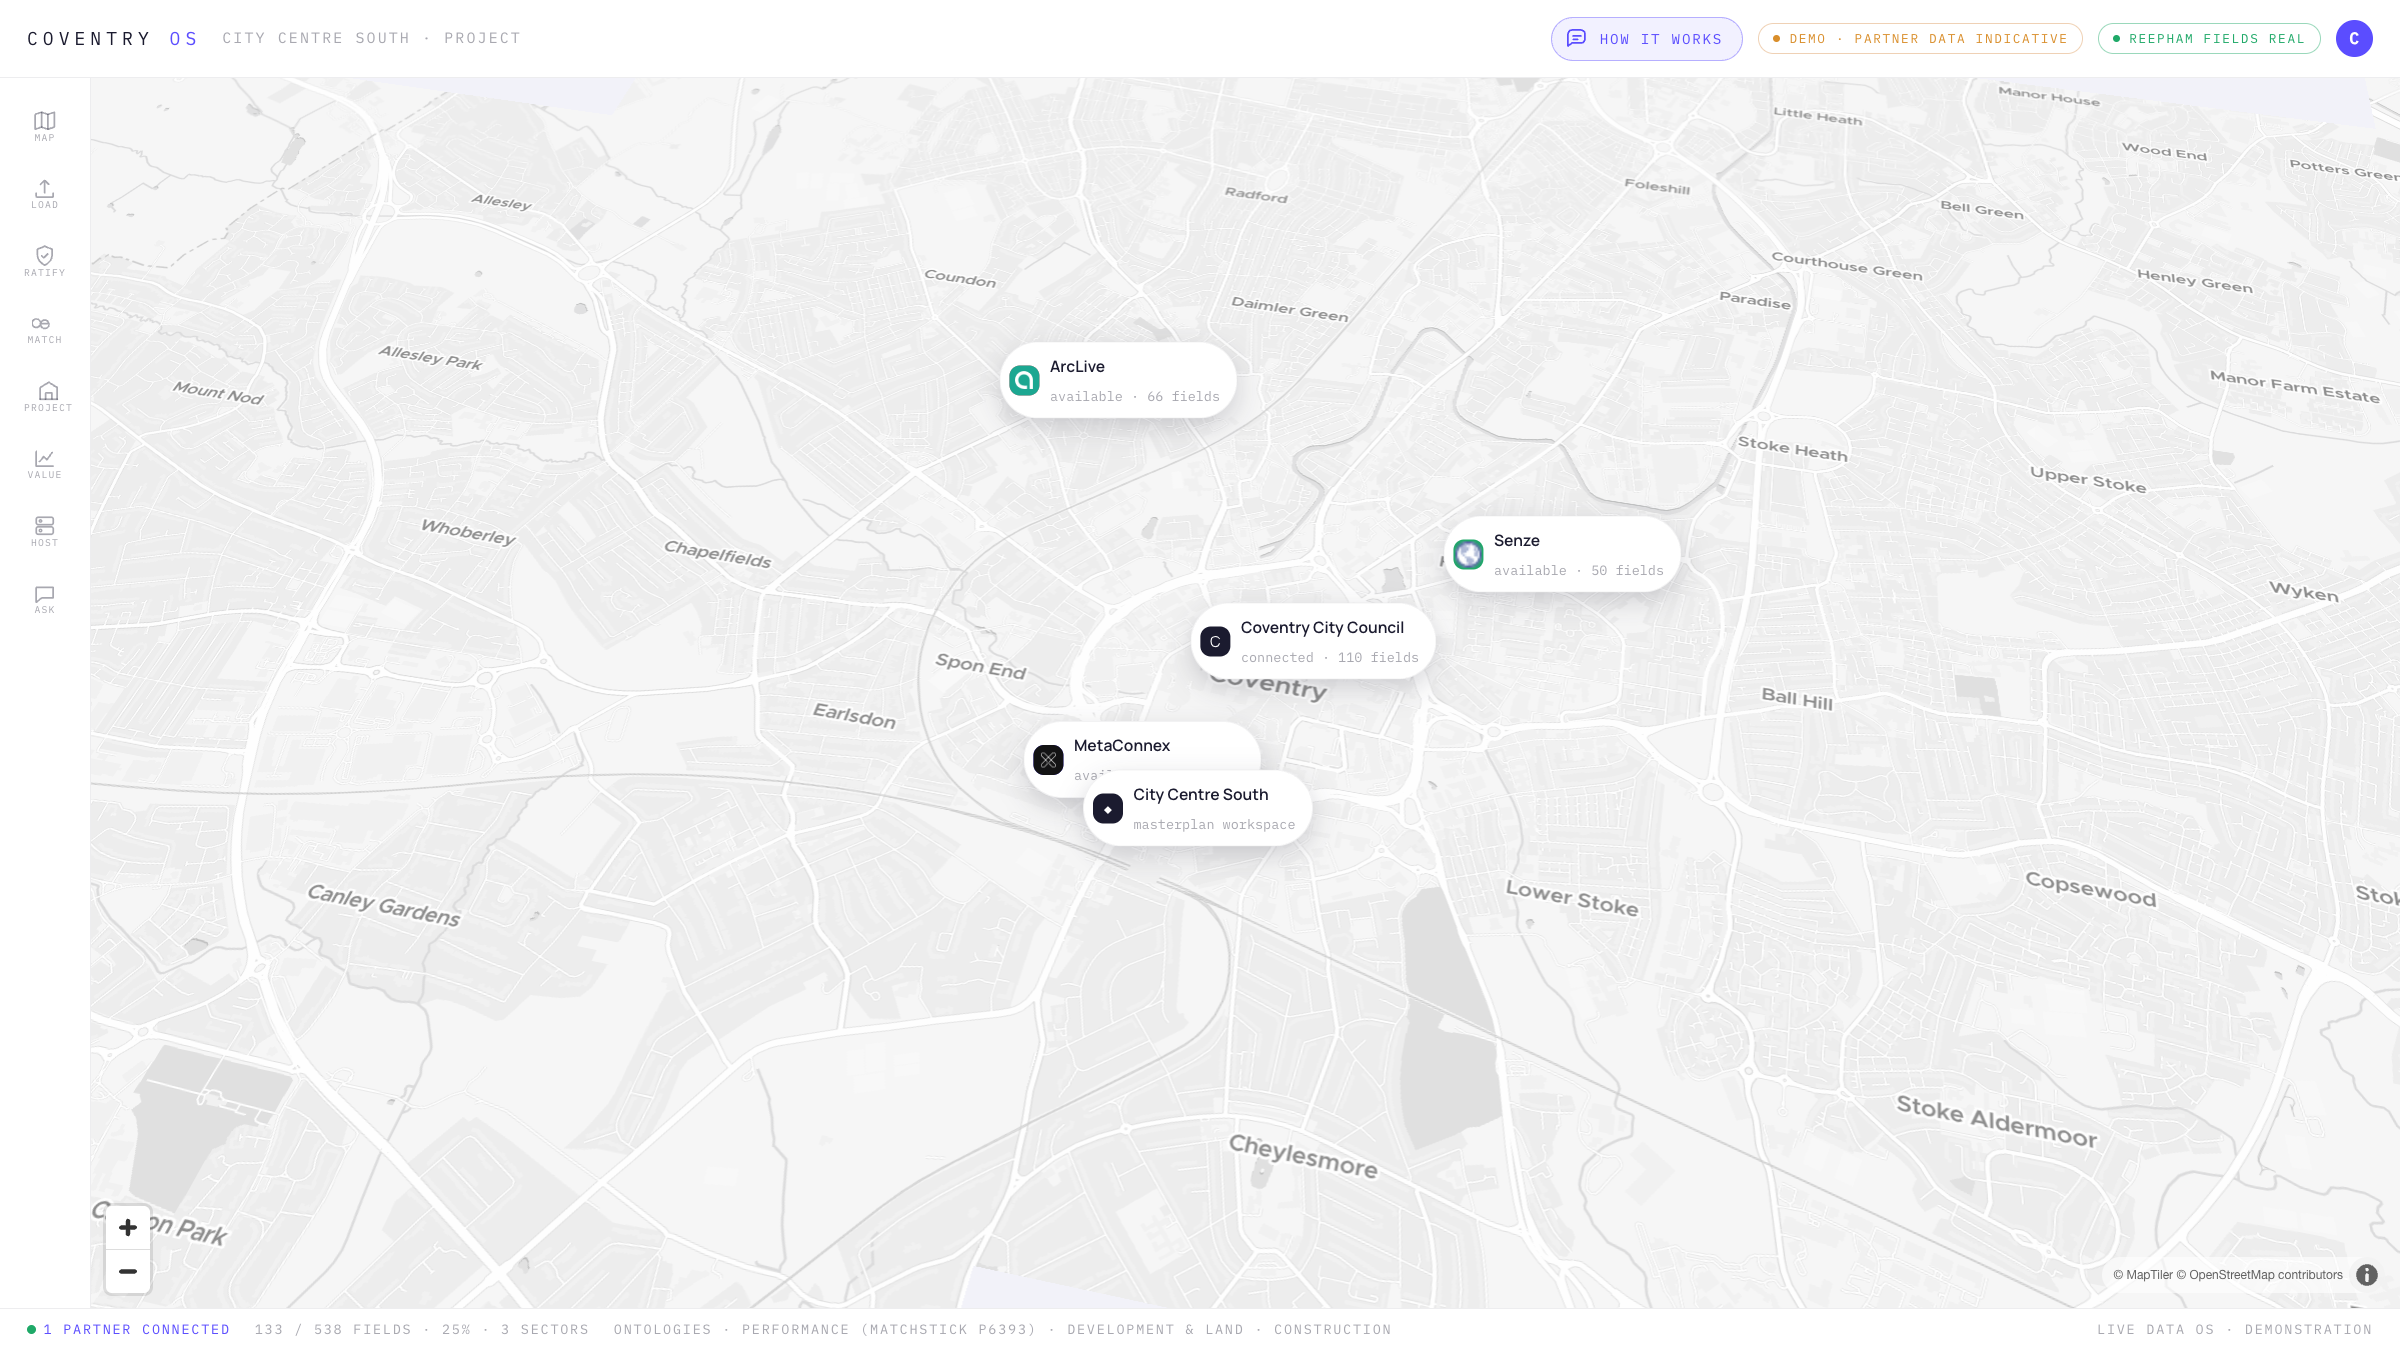
City Centre South on the real Coventry map: 133 of 538 fields, three sector dials, and the integration-partner rail. Every asset in space; the map is home.
The ingest
Drop a CSV — headers are matched to ontology fields in your browser, nothing uploaded. Or load the ArcLive Reepham evidence pack: real measured LTMA fields.

The catalog
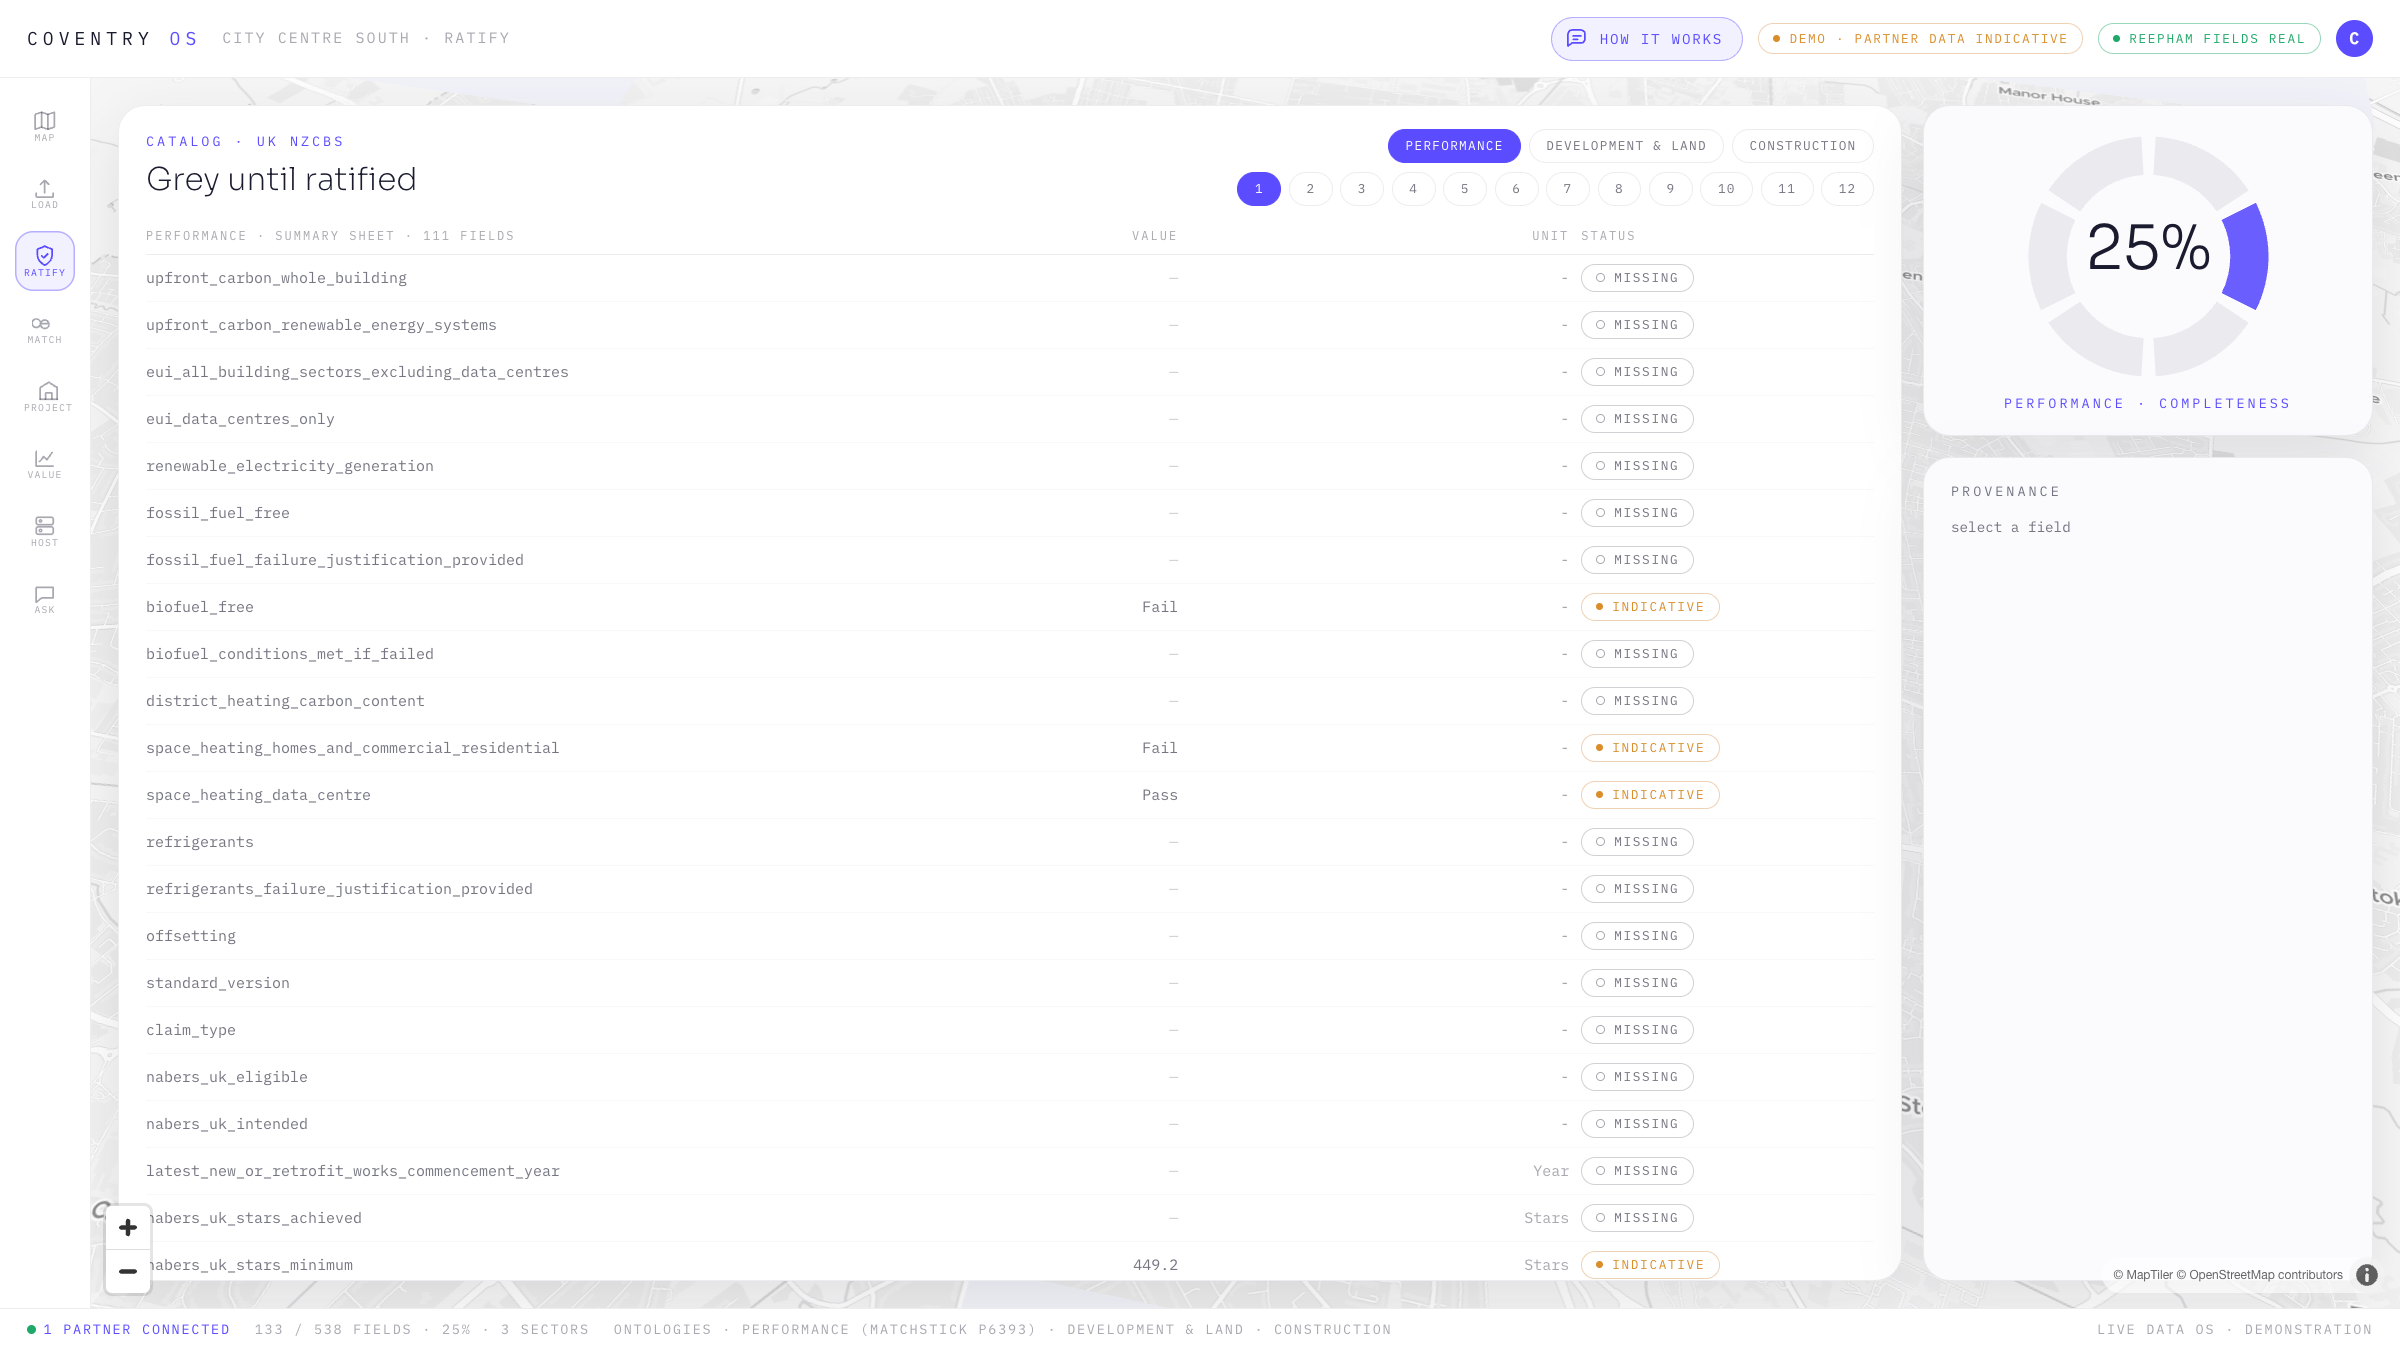
Grey until ratified. Every UK NZCBS field carries a status — missing, indicative, measured — and its provenance. The same Matchstick method runs across all three ontologies.
The engine
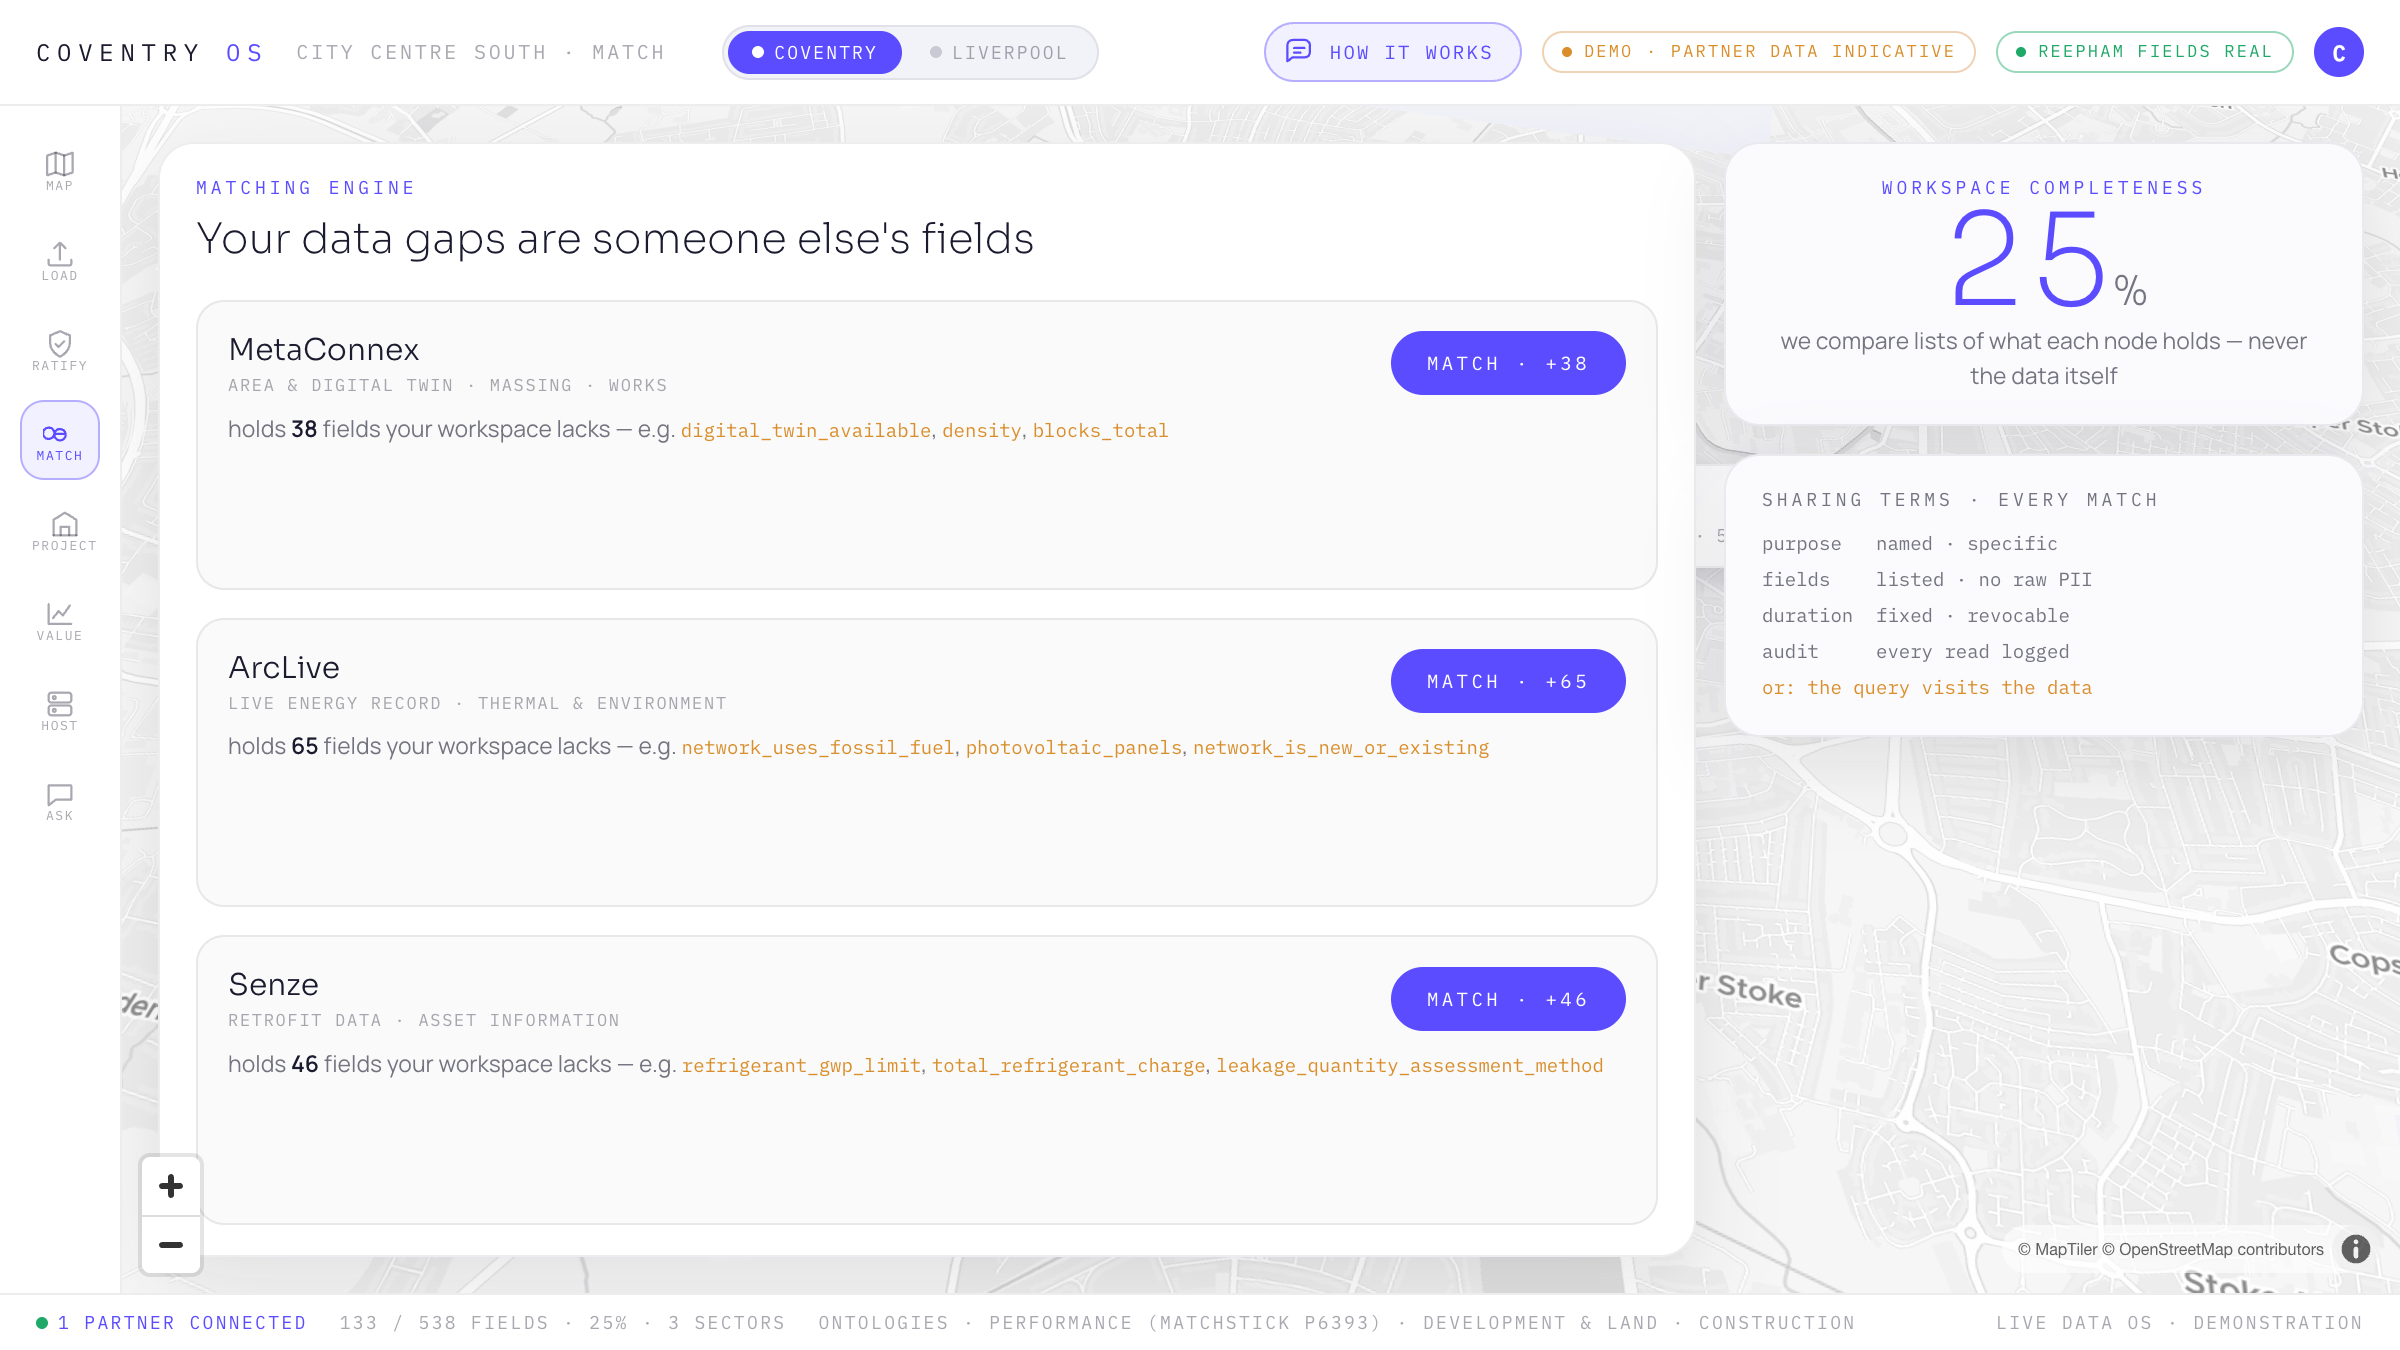
Your data gaps are someone else’s fields. MetaConnex holds 38 you lack, ArcLive 65, Senze 46 — matched on lists, never the data. Every match carries its sharing terms.
The place, every partner pinned
The masterplan as a delivery object: the whole city, each connector a node at its true location — the digital twin, energy and retrofit brought to one map.
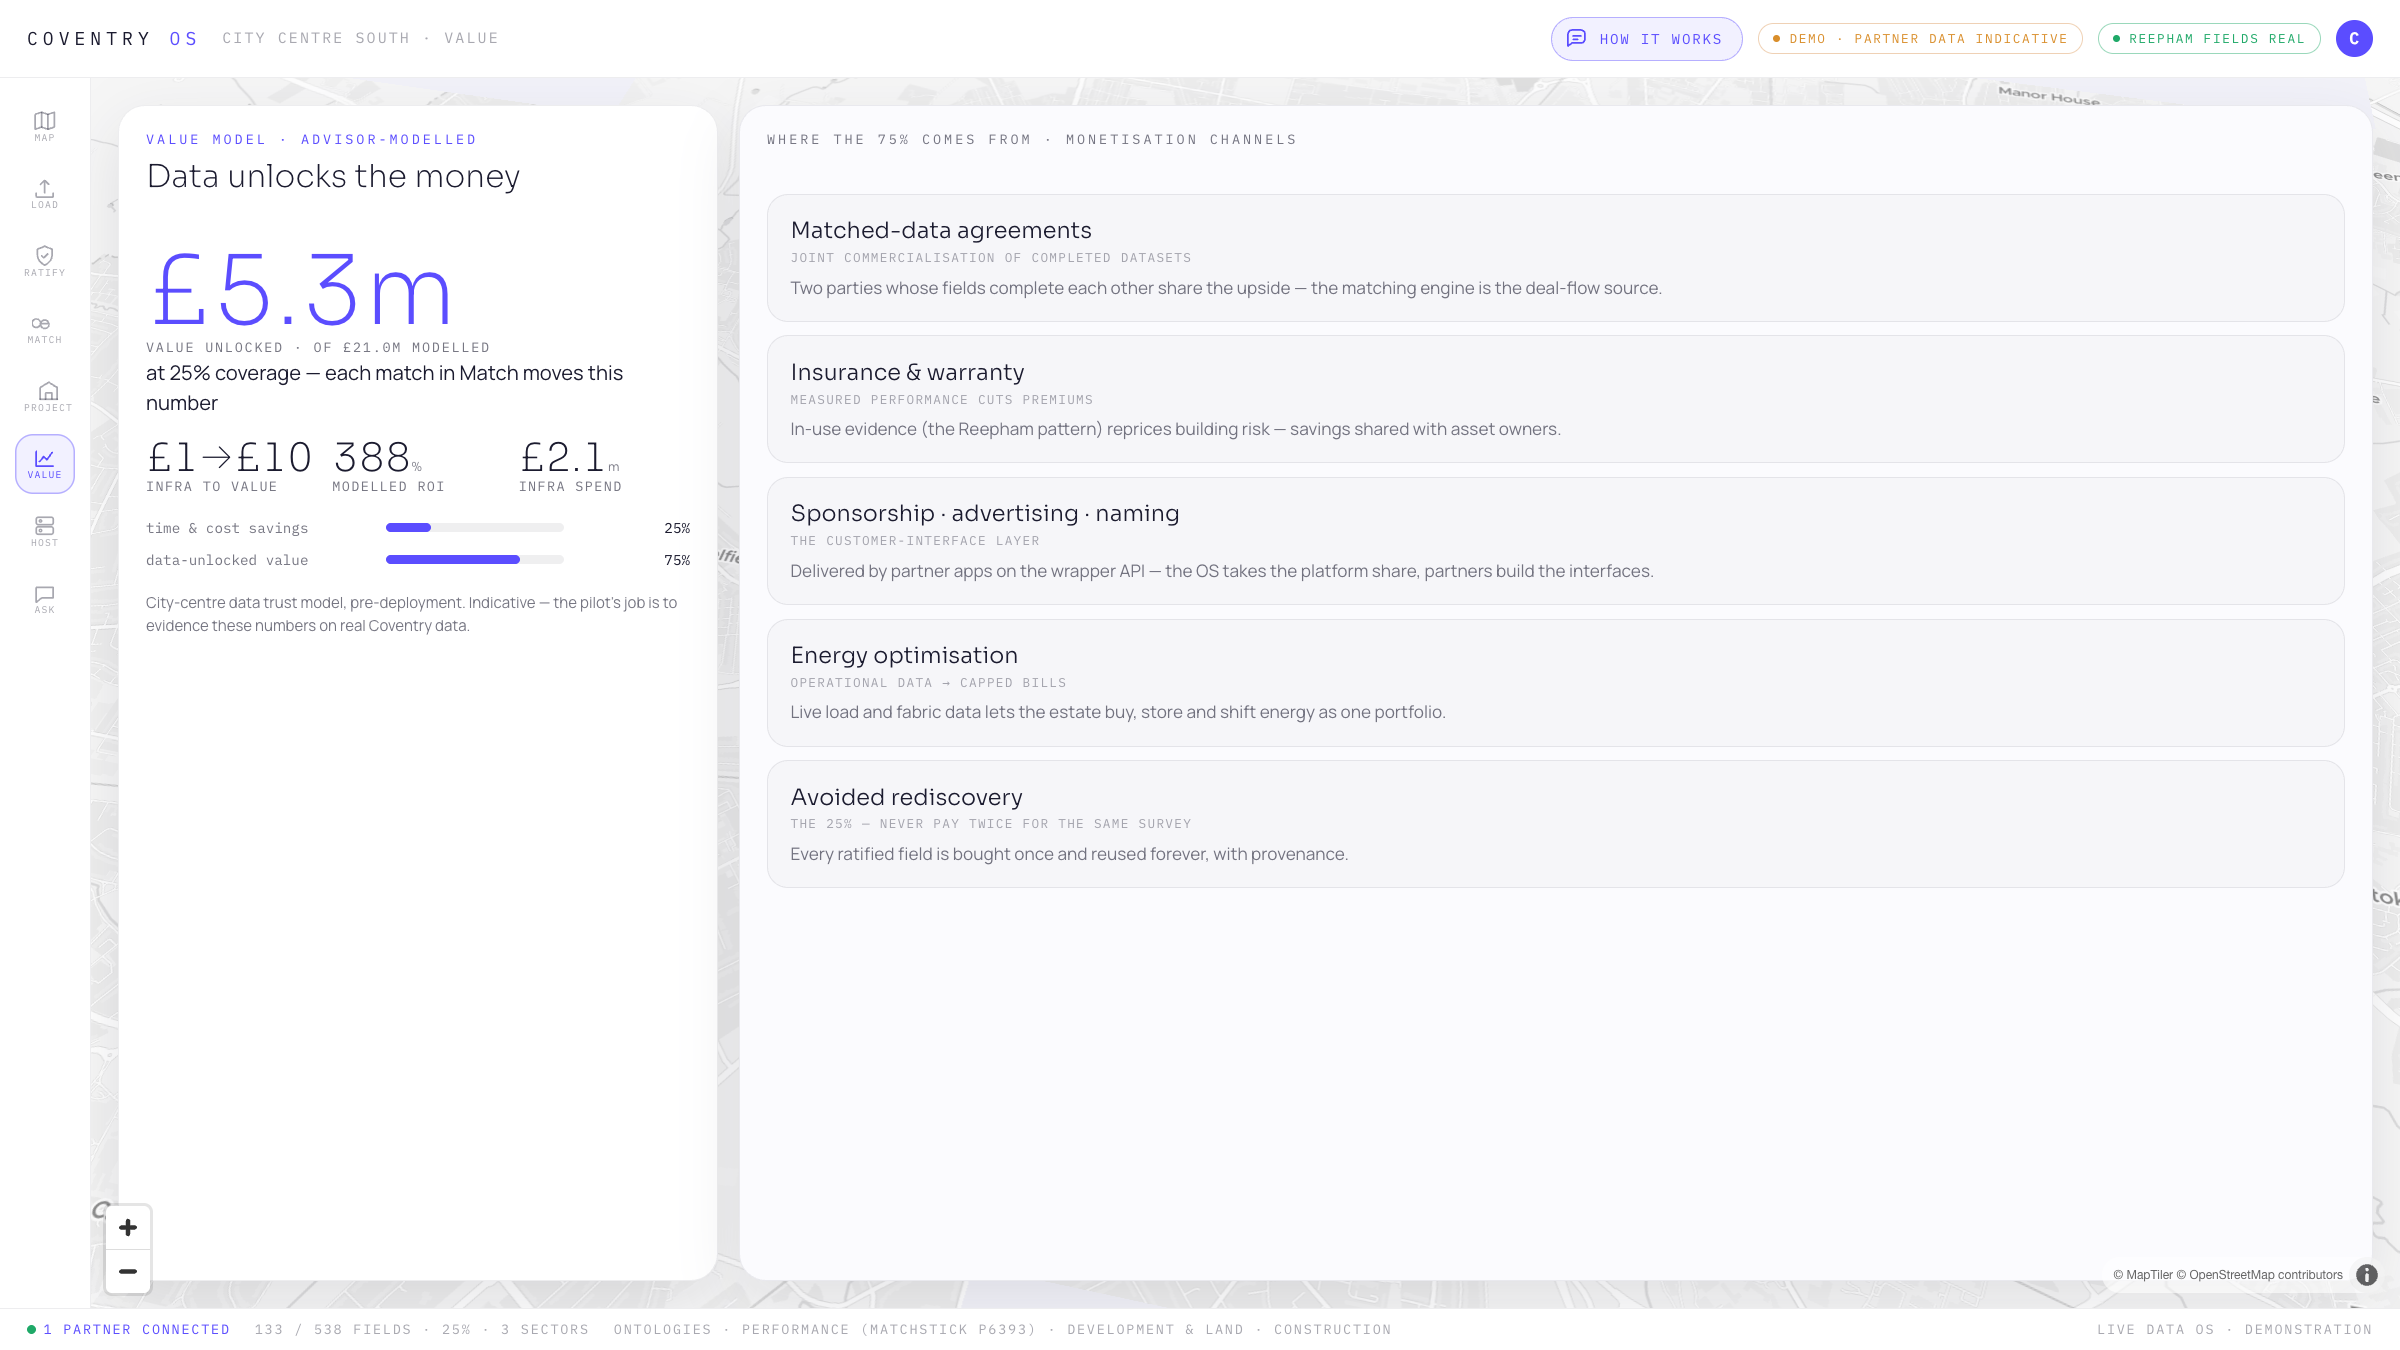
Data unlocks the money
Completeness is commercial: what each ratified sector is worth, and what filling the gaps opens up. The reason to onboard, made explicit.
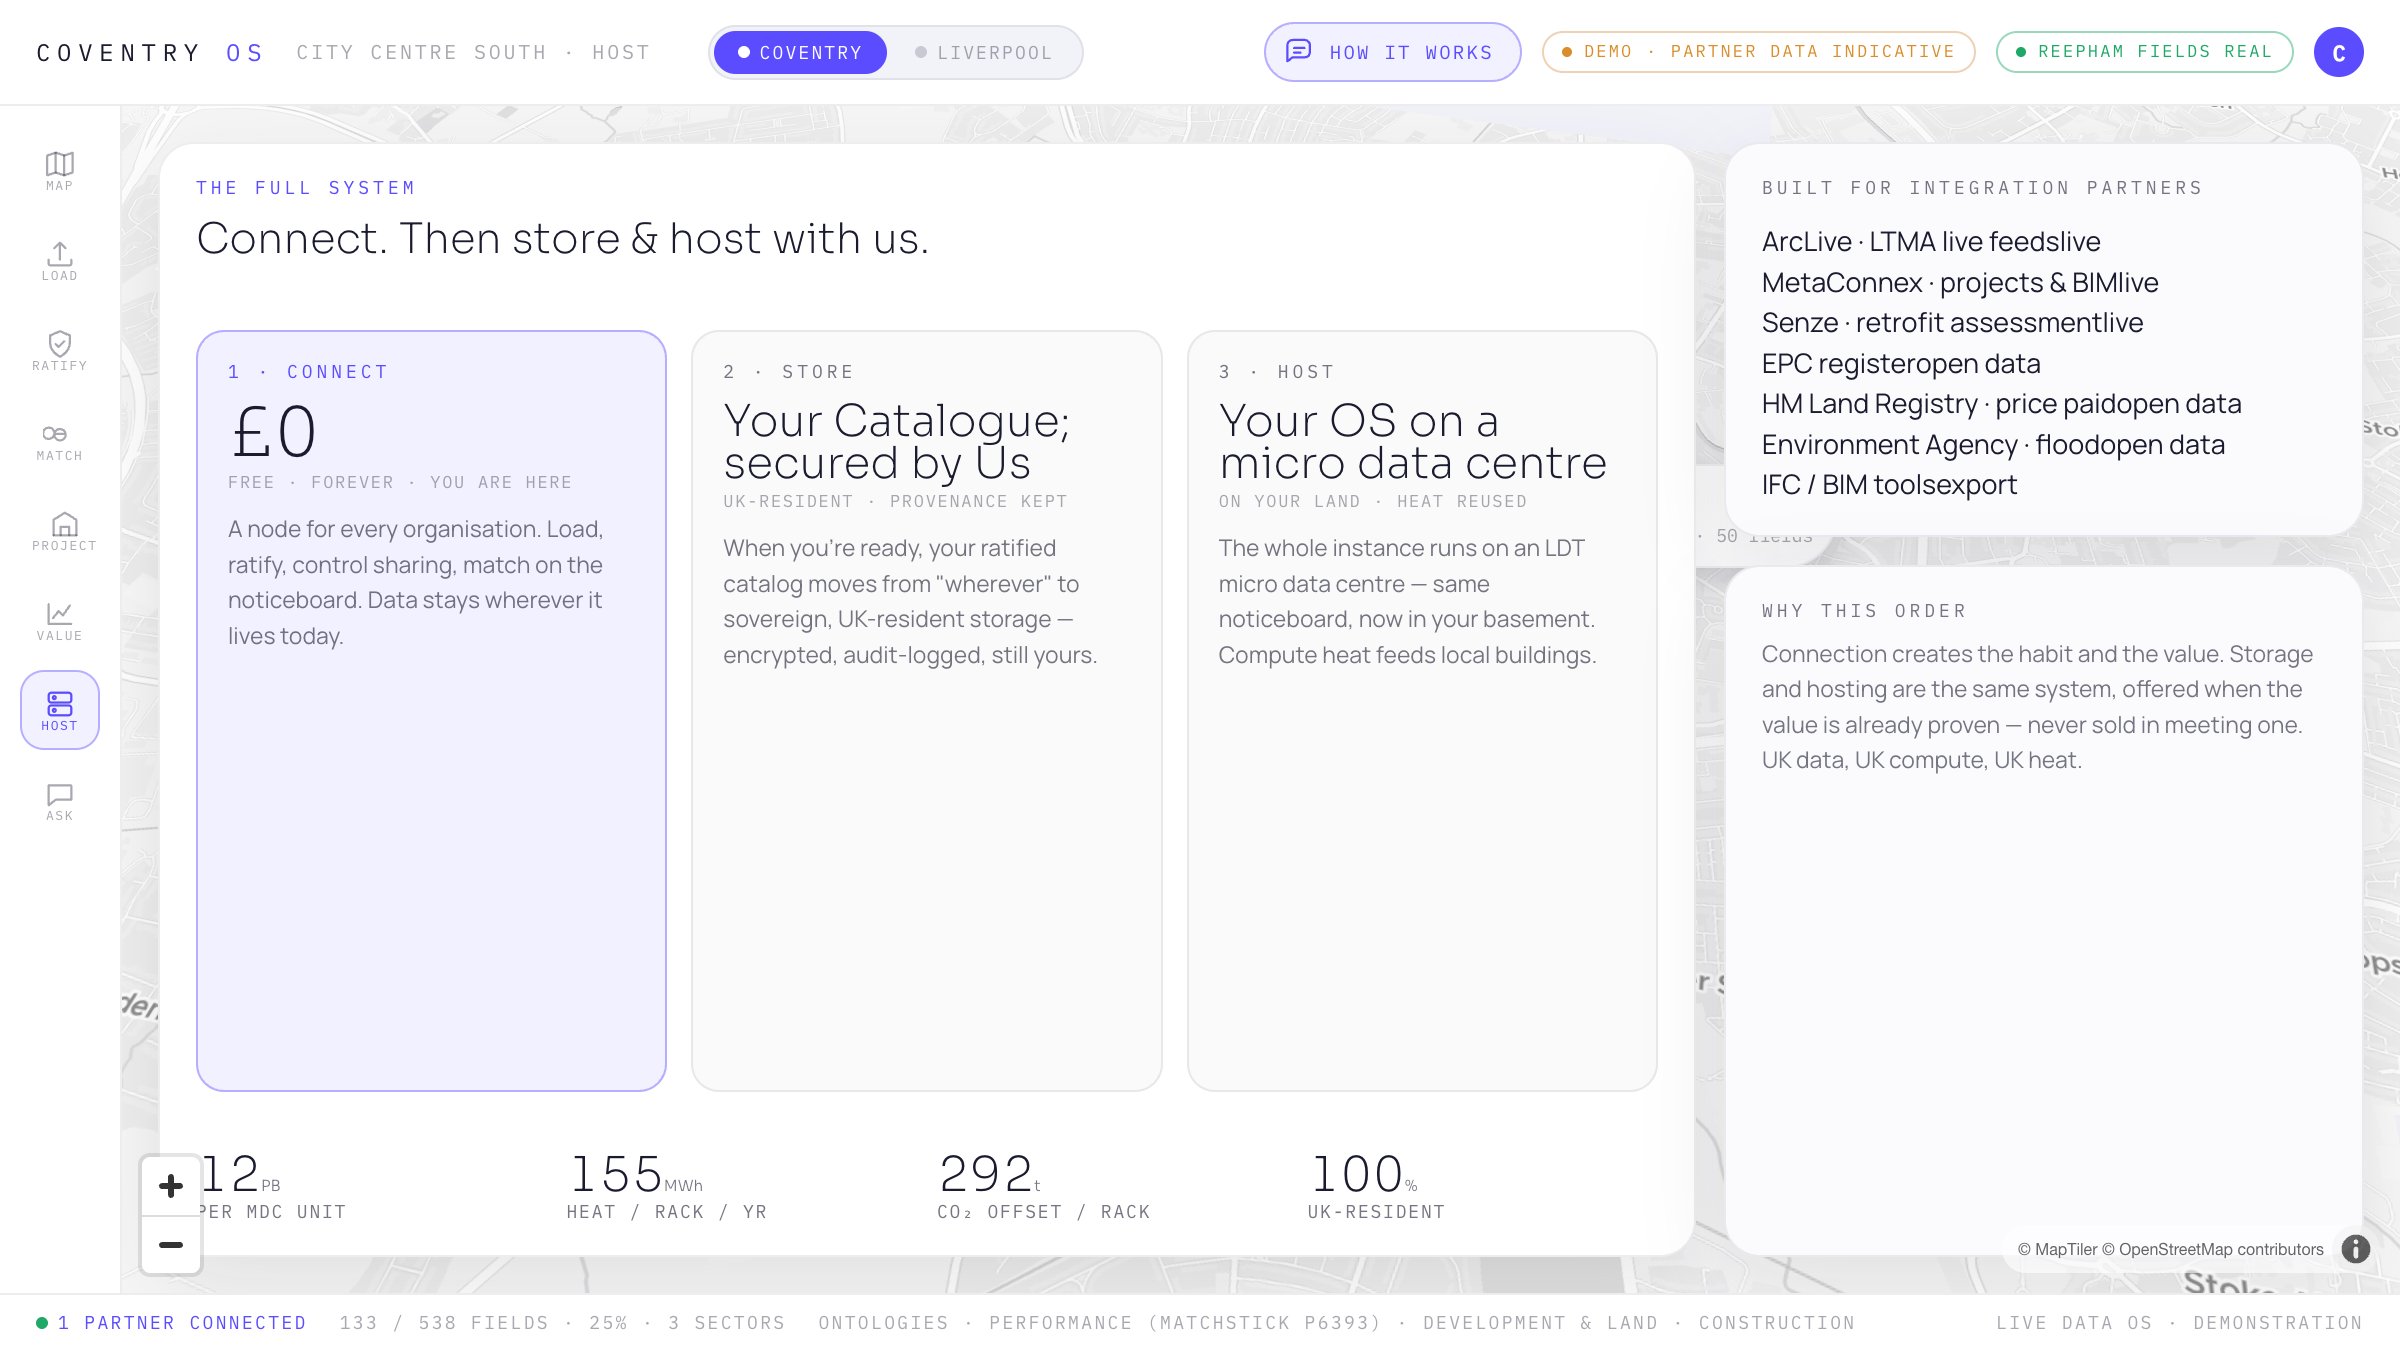
The full system
Connect £0 → your catalogue, secured by us → host your OS on an LDT micro data centre. UK data, UK compute, UK heat: 12 PB per unit, 100% UK-resident, compute heat feeding local buildings.
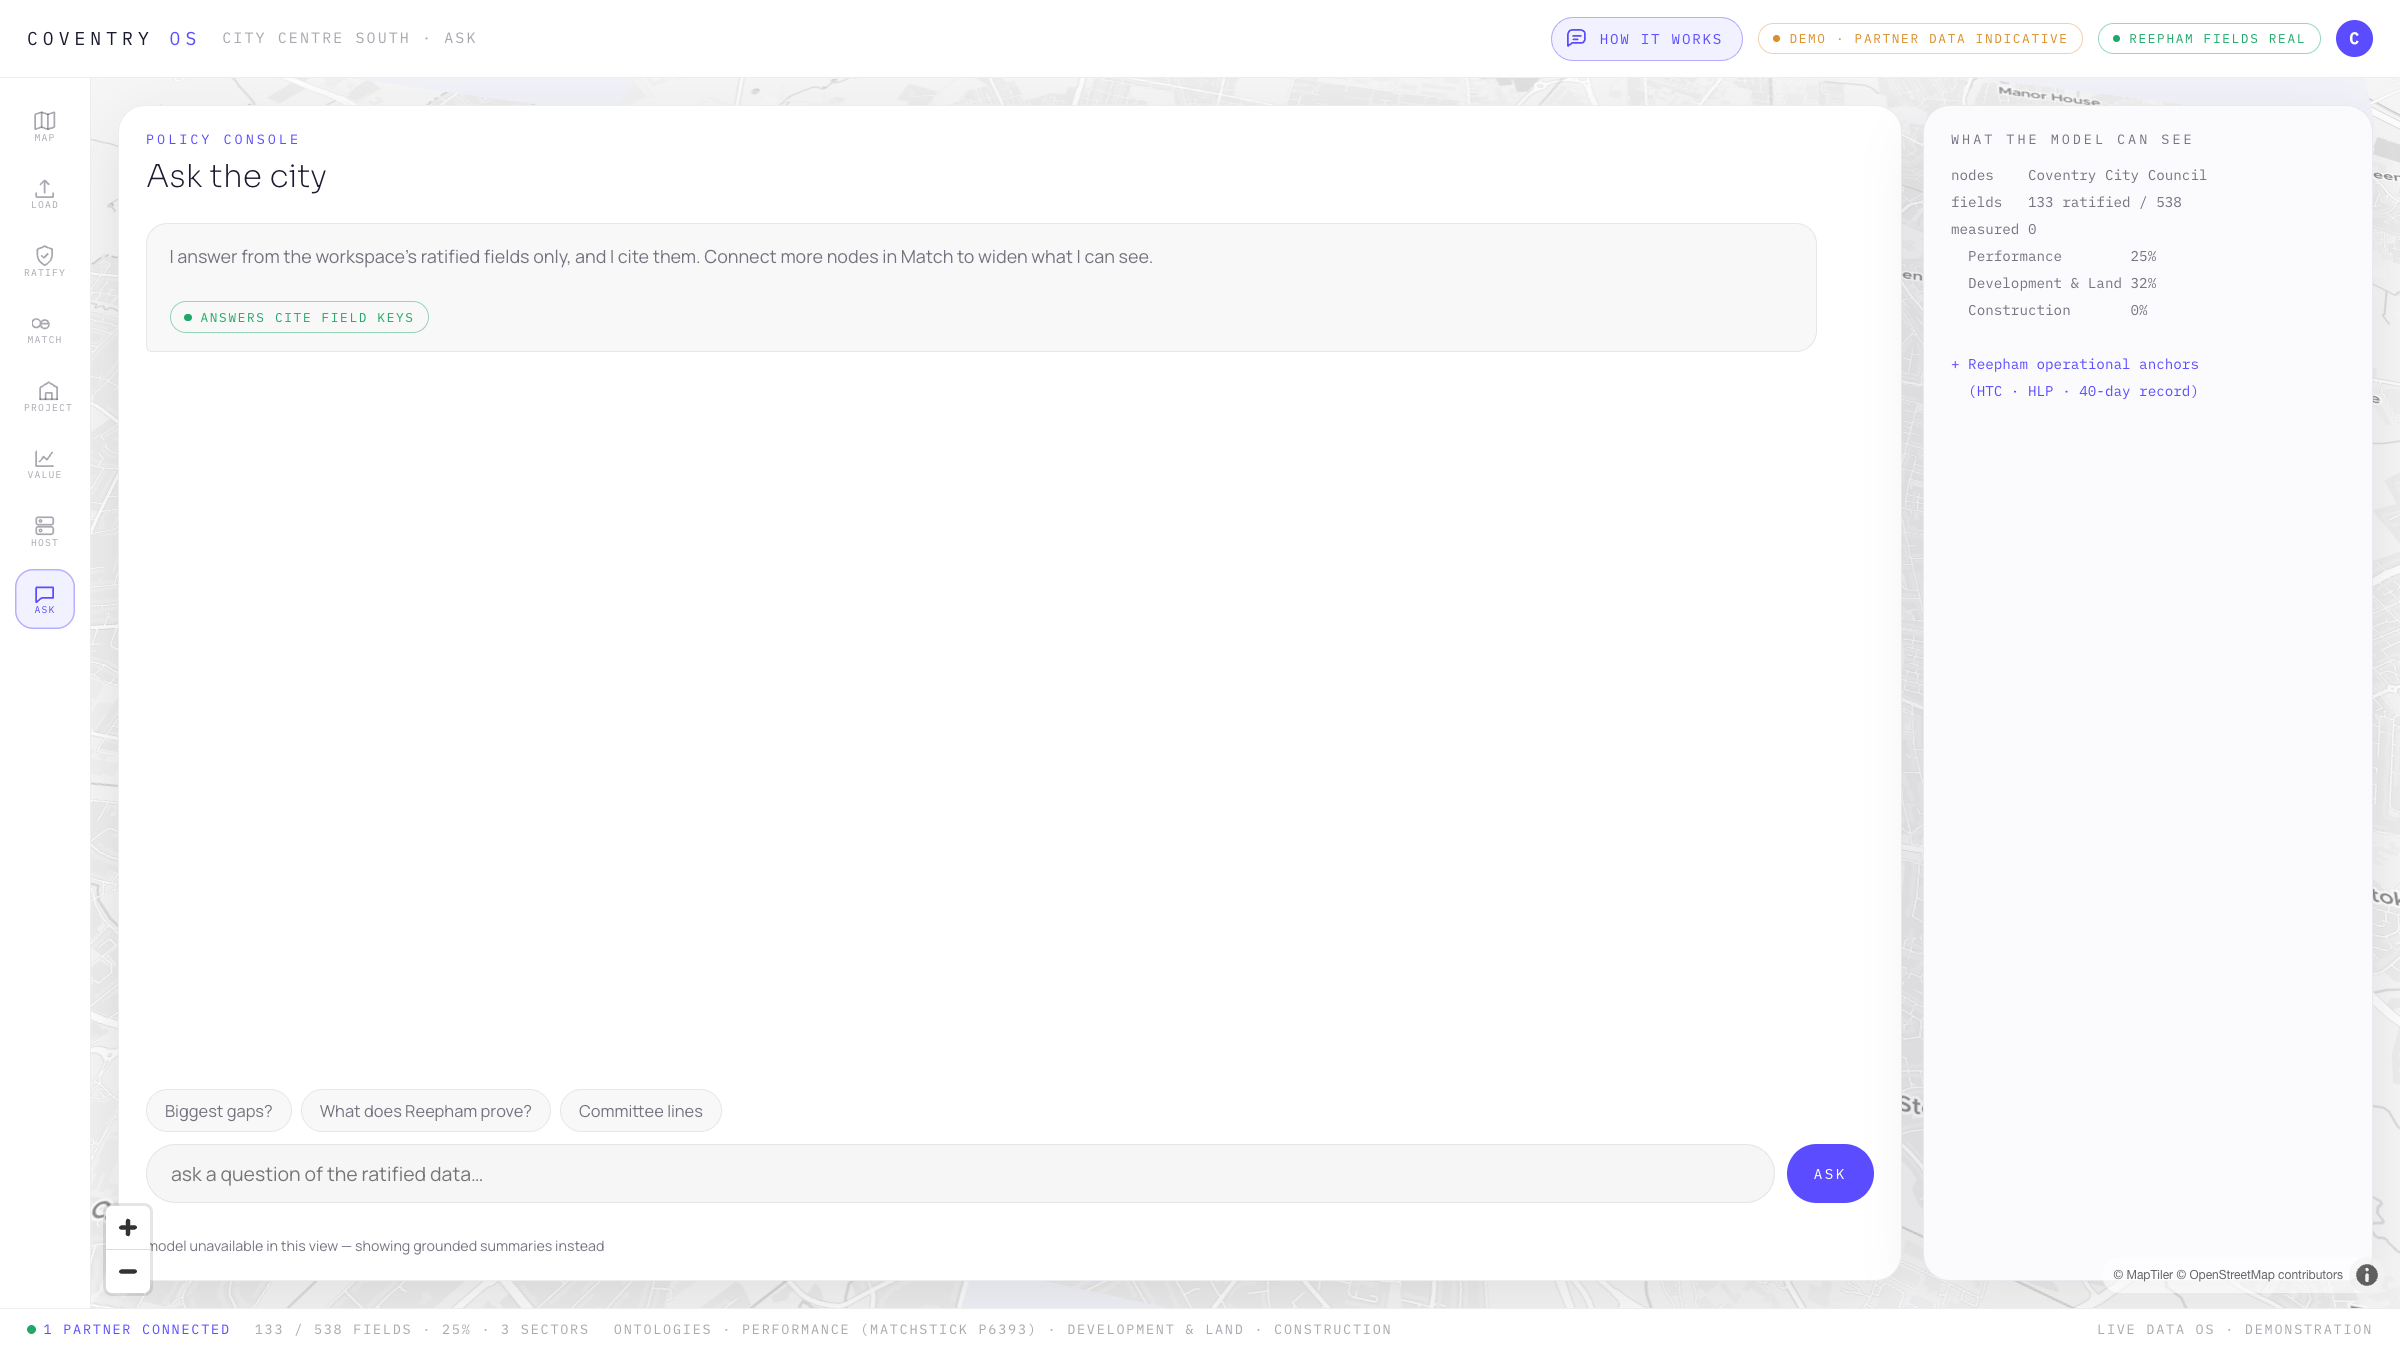
The policy console
Ask the city. The model answers from ratified fields only and cites the field keys — it can only see what has been ratified and matched, so the answer is always accountable. Data is used only anonymously in aggregate, so a place can pull policy reports without exposing any single party.
The proof, in one building
Reepham High School. SAP/EPC rate it around an F on design assumptions — yet the building runs close to passive in use. Three parties’ data, federated into one source of truth: ArcLive (live energy), Senze (digital twin), Resillium + Vaso (materials & measurement).
The standard misreads it because a steady-state U-value test measures conductive heat, while solar gain refracts and dissipates through glazing rather than conducting — the "Coca-Cola glass" effect. Run the real, measured coefficients (LTMA, validated at Salford to a ~1.3% central-estimate gap) against UK NZCBS instead of predicted inputs, and the picture flips. The method is already recognised — so this isn’t "change everything," it’s an alternative pathway, and the first evidence case for policy change.
Cambridge Matchstick, UKRI-funded — 408-field UK NZCBS live in the demo.
Reepham: 1.01 W/m²K in use, 59.4% below prediction; method validated at Salford to a 1.3% central-estimate gap.
MetaConnex (area & digital twin) · ArcLive (energy, live) · Senze (retrofit, measured).
EPC, Price Paid, INSPIRE, EA flood/LIDAR, OS PSGA — so day-zero onboarding starts useful.